Putting on my marketing hat: Random MailJet hack

(Yes, I do indeed wear multiple hats — marketing FTW, or is it WTF?)

Really wanted to use MailJet (BTW, guys, what’s with support and not being able to edit a campaign after launch? Get what I pay for?) to send users a list of items, dynamically. For example, say I have the following list of items, say, “forgotten” in a shopping cart:

User,Items
Alice,”bat, ball”
Bob,”racquet, shuttlecock”


And I want to send something like (notice I’d also like links there):

Hey Alice, did you forget this in your cart:

Ball
Bat

Turns out, loop construct doesn’t work. Aside: this is despite ChatGPT’s valiant attempt to suggest that something like this could work:

{{
{% set items = data.items|split(‘,’) %}
{% for item in items %}
{{ item.strip() }}
{% endfor %}
}}


But the answer is hacky but works. Because if you remember that SGML is OK with single quotes, then construct your contacts list like so:

User,Items

Alice,"<a href='https://www.amazon.com/BB-W-Wooden-baseball-bat-size/dp/B0039NKEZQ/'>bat</a>,<a href='https://www.amazon.com/Rawlings-Official-Recreational-Baseballs-OLB3BBOX3/dp/B00AWVNPMM/'>ball</a>
Bob,"<a href='https://www.amazon.com/YONEX-Graphite-Badminton-Racquet-Tension/dp/B08X2SXQHR/'>racquet</a>, <a href='https://www.amazon.com/White-Badminton-Birdies-Bedminton-Shuttlecocks/dp/B0B9FPRHBF'>shuttlecock</a>"


And make the HTML be just

Hey [[data:user:””]],

You did you forget this in your cart?
[[data:items:””]]


Works!

P.S. Links provided here are just whatever I found on Google, no affiliate marketing.

Fun with ChatGPT

So prompt engineering is all the rage (a friend of mine even wrote a bookyou magnificent bastard, I haven’t read it yet) — and I have a problem with trying to export GCP configuration for use with Deployment manager. Specifically, how to get CloudRun to work.

So an impressive session (and another one) result with some cool reasoning by ChatGPT in response to me pointing out that things don’t quite work (yes, Amigo Grady, I know it’s not reasoning)… Except that they don’t work.

Which I finally find via StackOverflow — because this feature is unsupported, per Google. But this info is probably outside the training data window of our esteemed LLM.

What’s the moral of the story? There is no moral — use it as a tool. Just a tool.

More random notes

  • Yeah, no-code/low-code is great (wave, OpenAI). Especially for growth-hacking, right (hello, Butcher)? But here’s your no-code platform — Google Ads. Gawd… I’d rather write code.
  • Why does FastAPILoggingHandler seems to ignore my formatter? I don’t know; but the fact that someone else also spends time figuring out the inane things that should just work is quite frustrating.
  • How many yaks have you shaved today?
  • O, GCP, how convenient: in the env var YAML sent to gcloud run you helpfully interpret things like “on”/”off”, “true”/”false”, “yes”/”no” as numbers, eh? And then you crash with:

    ERROR: gcloud crashed (ValidationError): Expected type <class 'str'> for field value, found True (type <class 'bool'>)

    Because of course you do.
  • “Overriding a number of default settings is key to shaving off unnecessary spend”. Yep.

Validation?

I recently learned about MediaMath’s custom brain. Excited for the validation of OpenDSP‘s concept of custom bidding logic. But it is a bit limited, being just a polynomial. MediaMath’s custom bid router provides way more flexibility — but you need your own infrastructure! So — I still think our approach — DSL-based scripting — is better, because it combines both!

Ad-hoc querying on AWS: Connecting BI tools to Athena

In a previous post, we discussed using Lambda, Glue and Athena to set up queries of events that are logged by our real-time bidding system. Here, we will build on that foundation, and show how to make this even friendlier to business users by connecting BI tools to this setup.

Luckily, Athena supports both JDBC and ODBC, and, thus, any BI tool that uses either of these connection methods can use Athena!

First, we need to create an IAM user. The the minimum policies required are:

  • AmazonAthenaFullAccess
  • Writing to a bucket for Athena query output (use an existing one or create a new one). For the sake of example, let’s call it s3://athena.out
  • Reading from our s3://logbucket which is where the logs are in

Now we’ll need the access and the secret keys for that user to use it with various tools. 

JDBC

JDBC driver (com.simba.athena.jdbc.Driver) can be downloaded here.

The JDBC URL is constructed as follows:

jdbc:awsathena://User=<aws-access-key>;Password=<aws-secret-key>;S3OutputLocation=s3://athena.out;

Here’s a sample Java program that shows it in action:

import java.sql.Connection;
import java.sql.DriverManager;
 
public class Main {
  public static void main(String[] args) throws Throwable {
    Class.forName("com.simba.athena.jdbc.Driver");
    String accessKey = "...";
    String secretKey = "...";
    String bucket = "athena.out";
    String url = "jdbc:awsathena://AwsRegion=us-east-1;User=" + accessKey + ";Password=" + secretKey
        + ";S3OutputLocation=s3://" + bucket +”;";
    Connection connection = DriverManager.getConnection(url);
    System.out.println("Successfully connected to\n\t" + url);
  }
}

Example using JDBC: DbVisualizer

  1. If you haven’t already, download the JDBC driver to some folder.
  2. Open Driver Manager (Tools-Driver Manager)
  1. Press green + to create new driver
  1. Press the folder icon on the right …
  1. … and browse to the folder where you saved the JDBC driver and select it:
  1. Leave the URL Format field blank and pick com.simba.athena.jdbc.Driver for Driver Class:
  1. Close the Driver Manager, and let’s create a Connection:
  1. We’ll use “No Wizard” option. Pick Athena from the dropdown in the Driver (JDBC) field and enter the JDBC URL from above in the Database URL field:
  2. Press “Connect” and observe DbVisualizer read the metadata information from Athena (well, Glue, really), including tables and views.

ODBC (on OSX)

  1. Download run ODBC driver installer
  2. Create or edit /Library/ODBC/odbcinst.ini to add the following information:
    [ODBC Drivers]
    Simba Athena ODBC Driver=Installed
    [Simba Athena ODBC Driver]
    Driver = /Library/simba/athenaodbc/lib/libathenaodbc_sbu.dylib

    If the odbcinst.ini file already has entries, put new entries into the appropriate sections; e.g., if it was
    [ODBC Drivers]
    PostgreSQL Unicode = Installed
    [PostgreSQL Unicode]
    Description = PostgreSQL ODBC driver
    Driver = /usr/local/lib/psqlodbcw.so

    Then it becomes
     [ODBC Drivers]
    PostgreSQL Unicode = Installed
    Simba Athena ODBC Driver=Installed
    [PostgreSQL Unicode]
    Description = PostgreSQL ODBC driver
    Driver = /usr/local/lib/psqlodbcw.so
    [Simba Athena ODBC Driver]
    Driver = /Library/simba/athenaodbc/lib/libathenaodbc_sbu.dylib
  3. Create or edit, in a similar fashion, /Library/ODBC/odbc.ini to include the following information:
    [AthenaDSN]
    Driver=/Library/simba/athenaodbc/lib/libathenaodbc_sbu.dylib
    AwsRegion=us-east-1
    S3OutputLocation=s3://athena.out
    AuthenticationType=IAM Credentials
    UID=AWS_ACCESS_KEY
    PWD=AWS_SECRET_KEY
  4. If you wish to test, download and run ODBC Manager. You should see that it successfully recognizes the DSN:

Example using ODBC: Excel

  1. Switch to Data tab, and under New Database Query select From Database:
  1. In the iODBC Data Source Chooser window, select AthenaDSN we configured above and hit OK. 
  1. Annoyingly, despite having configured it, you will be asked for credentials again. Enter the access and secret key.
  2. You should see a Microsoft Query window. 

Success!

Helpful links

Ad-hoc querying on AWS: Lambda, Glue, Athena

Introduction

If you give different engineers the same problem they will usually produce reasonably similar solutions (mutatis mutandis). For example, when I first came across a reference implementation of an RTB platform using AWS, I was amused by how close it was to what we have implemented in one of my previous projects (OpenRTB).

So it would be not much of a surprise that in the next RTB system, a similar pattern was used: logs are written to files, pushed to S3, then aggregated in Hadoop from where the reports are run.

But there were a few problems in the way… 

Log partitioning

The current log partitioning in S3 is by server ID.  This is really useful for debugging, and is fine for some aggregations, but not really good for various reasons – it is hard to narrow things by date, resulting in large scans. It is, therefore, even harder to do joins. Large scans in tools like Athena also translate into larger bills. In short, Hive-like partitioning would be good. 

To that end, I’ve created a Lambda function, repartition, which is triggered when a new log file is uploaded to s3://logbucket/ bucket:

import boto3
from gzip import GzipFile
from io import BytesIO
import json
import urllib.parse

s3 = boto3.client('s3')

SUFFIX = '.txt.gz'

V = "v8"

def lambda_handler(event, context):
    #print("Received event: " + json.dumps(event, indent=2))

    # Get the object from the event and show its content type
    bucket = event['Records'][0]['s3']['bucket']['name']
    key = urllib.parse.unquote_plus(event['Records'][0]['s3']['object']['key'], encoding='utf-8')
    try:
        s3obj = s3.get_object(Bucket=bucket, Key=key)
        src = { 'Bucket': bucket, 'Key': key }
        (node, orig_name) = key.split("/")
        (_, _, node_id) = node.split("_")
        name = orig_name.replace(SUFFIX, "")
        (evt, dt0, hhmmss) = name.split("-")
        hr = hhmmss[0:2]
        # date-hour
        dthr = f"year=20{dt0[0:2]}/month={dt0[2:4]}/day={dt0[4:6]}/hour={hr}"
        
        schema = f"{V}/{evt}/{dthr}"
        dest = f"{schema}/{name}-{node_id}{SUFFIX}"
        print(f"Copying {key} to {dest}")
        s3.copy_object(Bucket=bucket, Key=dest, CopySource=src)

        return "OK"
    except Exception as e:
        print(e)
        print('Error getting object {} from bucket {}. Make sure they exist and your bucket is in the same region as this function.'.format(key, bucket))
        raise e

if __name__ == "__main__":
    # Wrapper to run from CLI for now
    s3entry = {'bucket' : {'name' : 'logbucket'},
               'object' : {'key'  : server/requests-200420-003740.txt.gz'}}
    event = {'Records' : [{'s3' : s3entry}] }
    lambda_handler(event, None)
    

At that time, the log is copied to a new path is created under v8 prefix, with the following pattern:

<event>/year=<year>/month=<month>/day=<day>/hour=<hour>/<filename>-<nodeID>. For example, 

s3://logbucket/server1234/wins-200421-000003.txt.gz

is copied to 

s3://logbucket/v8/wins/year=2020/month=04/day=21/hour=00/wins-200421-000003-1234.txt.gz

(The “v8” prefix is there because I have arrived at this schema having tried several versions — 7, to be exact).

What about storage cost?

  • An additional benefit of using date-based partitioning is that we can easily automate changing storage type to Glacier for folders older than some specified time, which will save S3 storage costs of the duplicate data.
  • In the cloud, the storage costs are not something to worry about; the outgoing traffic and compute is where the problem is at. So move the compute to the data, not the other way around.

NOTE: Partitions do not equal timestamps

Partitioning is based on the file name. Records inside the file may have timestamps whose hour one greater than or one less than the partition hour, for obvious reasons. Thus, partitions are there to reduce the number of scanned records, but care should be taken when querying to not assume that the timestamps under year=2020/month=04/day=21/hour=00 all are in the 0th hour of 2020-04-21.

Discover metadata in Glue

Glue is an ETL service on AWS. One of the great features of Glue is crawlers that attempt to glean metadata from the logs. This is really convenient because it saves us the tedious step of defining the metadata manually.

So we set up a crawler. For explanation on how to do it, see the “Tutorial” link on the left hand side of this page:

However, it takes some time to get the configuration correct. 

  1. We would want to exclude some logs because we know their format is not good for discovery (they are not straight-up JSON or CSV, etc; and, at the moment, custom SerDes are not supported by Athena) — but see below for exceptions. This is done in the “Data store” part of crawler configuration:
  1. We want Glue to treat new files of the same type as being different partitions of the same table, not create new ones. For example, given the partitioning convention we created above, these two paths:
  • s3://logbucket/v8/wins/year=2020/month=04/day=21/hour=00/wins-200421-000003-1234.txt.gz
  • s3://logbucket/v8/wins/year=2020/month=04/day=22/hour=11/wins-200422-000004-4321.txt.gz

 Should be treated as partitions of table “wins”, not two different tables. We do this on the “Output” section of the crawler configuration as follows:

Once the crawler runs, we will see a list of tables created in Glue.

If here we see tables looking like parts of the partitioned path (e.g., year=2020, or ending with _txt_gz), it means the crawler got confused when discovering their structure. We are adding those to the crawler’s exclusion list, and will create their metadata manually. Fortunately, there are not that many such logs, and we can exclude them one by one.

Of course, while the crawler can recognize the file structure, it doesn’t know what to name the fields. So we can go and name them manually. While this is a tedious process, we don’t have to do that all at once – just do it on the as-needed basis. 

We will want to keep the crawler running hourly so that new partitions (which get created every hour) are picked up. (This can also be done manually from Athena – or Hive — by issuing MSCK REPAIR TABLE command).

First useful Athena query

Looking now at Athena, we see that metadata from Glue is visible and we can run queries:

Woohoo! It works! I can do nice ad hoc queries. We’re done, right?

Almost. Unfortunately, for historical reasons, our logs are not always formatted to work with this setup ideally.

We could identify two key cases:

  1. Mostly CSV files:
    • There are event prefixes preceding the event ID, even though the event itself is already defined by the log name. For example, bid:<BID_ID>, e.g.:
      bid:0000-1111-2222-3333
    • A CSV field in itself contains really two values. E.g., a log that is comma-separated into two fields: timestamp and “message”, which includes “Win: ” prefix before bid ID, and then – with no comma! – “price: ” followed by price. Like so:
      04/21/2020 00:59:59.722,Win: a750a866-8b1c-49c9-8a30-34071167374e_200421-00__302 price:0.93
      However, what we want to join on is the ID. So in these cases, we can use Athena views. For example, in these respective cases we can use:
       CREATE OR REPLACE VIEW bids2 AS
      SELECT "year", "month", "day", "hour",
      "SUBSTRING"("bid_colon_bid_id", ("length"('bid:') + 1)) "bid_id"
      FROM bids

      and
       CREATE OR REPLACE VIEW bids2 AS
      SELECT "year", "month", "day", "hour",
      "SPLIT_PART"("message", ' ', 3) "bid_id"
      FROM wins

      Now joins can be done on bid_id column, which makes for a more readable query.
  2. The other case is a log that has the following format: a timestamp, followed by a comma, followed by JSON (an OpenRTB request wrapped in one more layer of our own JSON that augments it with other data). Which makes it neither CSV, nor JSON. Glue crawler gets confused. The solution is using RegEx SerDe, as follows:

    And then we can use Athena’s JSON functions to deal with the JSON column, for example, to see distribution of requests by country:
     SELECT JSON_EXTRACT_SCALAR(request, '$.bidrequest.device.geo.country') country,
    COUNT(*) cnt
    FROM requests
    GROUP BY
    JSON_EXTRACT_SCALAR(request, '$.bidrequest.device.geo.country')
    ORDER BY cnt DESC
    Success! We can now use SQL to easily query our event logs.

Helpful links

A look at app-ads.txt

Introduction

App-ads.txt is a follow-up to IAB’s ads.txt initiative aimed at increasing transparency in the programmatic ad marketplace. Related to it are a number of other initiatives and standards such as supply chain, payment chain, sellers.json, various things coming out of TAG group, etc. See last section for relevant links.

TL;DR: This standard allows an ad inventory buyer (DSP) to verify whether the entity selling the inventory (SSP) is authorized by the publisher to sell it. This is done by looking up the the publisher’s URL for an app (bundle) in the app store, and examining app-ads.txt file at that URL. The file lists authorized sellers of the publisher’s inventory, along with an ID that this publisher should be identified by in the reseller’s system (publisher.id in OpenRTB).

Terminology

Here, the words “publisher” and “developer” may be used interchangeably; ditto for “app” and “bundle”.

First pass implementation

The algorithm is fairly simple: for each app – aka bundle – of interest, grab the app publisher’s domain from the appropriate app store, fetch app-ads.txt file from that domain and parse it. But of course, in theory there is no difference between theory and practice, but in practice there is. In reality, there are some deviations from the standard and exceptional cases that had to be taken care of in the process.

As a first pass, we are running this process semi-manually; if the results warrant full automation, this can easily be accomplished. Here is what was done (more technical details can be found on GitHub):

  1. Bundle IDs and other information was retrieved from request log for the last few days (really, requests for all bids in May as of end of May 6), using a query to Athena. This comes to a total of:
    1. 1,144,377 bids
    2. 613,241 unique bundle IDs.
    3. 685,221 bundle-SSP combinations
  2. The result set, exported as CSV file is loaded into SQLite DB. The same SQLite DB is also used for caching of results.
  3. Go through the list of bundles with a Python script, appadsparser.py.While ads.txt standard provides the specification of how app stores should provide publisher information, only Google Play Store currently follows it. For Apple’s App Store, we crawl its search API’s lookup service, and, if not found there, directly the App Store’s page (though this appears to be a violation of robots.txt).
  4. The result is a semi-structured log. The summary is below.

Results Notes

Result codes

The following are result codes and their meaning:

  • OK – The SSP we got the traffic on is authorized by the bundle publisher’s app-ads.txt for the publisher ID specified in request
  • OK_GOOGLE – Google is authorized by the bundle publisher’s app-ads.txt. See below on explanation of why Google is special.
  • PROBLEMS — Mismatch found between authorized SSPs and/or publisher IDs in app-ads.txt.
  • NO_APPADS_TXT – Publisher’s website has no app-ads.txt file
  • NOT_FOUND_IN_PLAY_STORE – bundle not found in Google Play Store. NOT_FOUND_IN_ITUNES – same for Apple App Store.
  • NO_URL_IN_PLAY_STORE – cannot find publisher’s URL in Google Play Store. NO_URL_IN_ITUNES – same for Apple App Store.
  • FACEBOOK_URL – publisher’s URL points to a Facebook page (this happens often enough that it warrants its own status) BAD_DEV_URL – publisher’s URL in an app store is invalid
  • BAD_BUNDLE_ID – store URL (from the OpenRTB request) is invalid, and cannot be determined from the bundle ID either

    Note on Google

    NOTE: At the moment, there is no way to check the publisher ID for Google due to an internal issue. In other words, we cannot verify the following part of the spec:

    Field #2 - Publisher’s Account ID - This must contain the same value used in transactions (i.e. OpenRTB bid requests) in the field specified by the SSP/exchange. Typically, in OpenRTB, this is publisher.id.
    

    Given Google’s aggressive anti-fraud enforcement, we can for now stipulate that it would not run unauthorized inventory. There is still the possibility of fraud, of course. But in the below table we distinguish between bundles served via Google (where we do not check for publisher ID, just the presence of Google in app-ads.txt) and those served via other SSPs, where we cross-reference the publisher ID.

    As a corollary of the above you will not see Google inventory under “PROBLEMS” status.

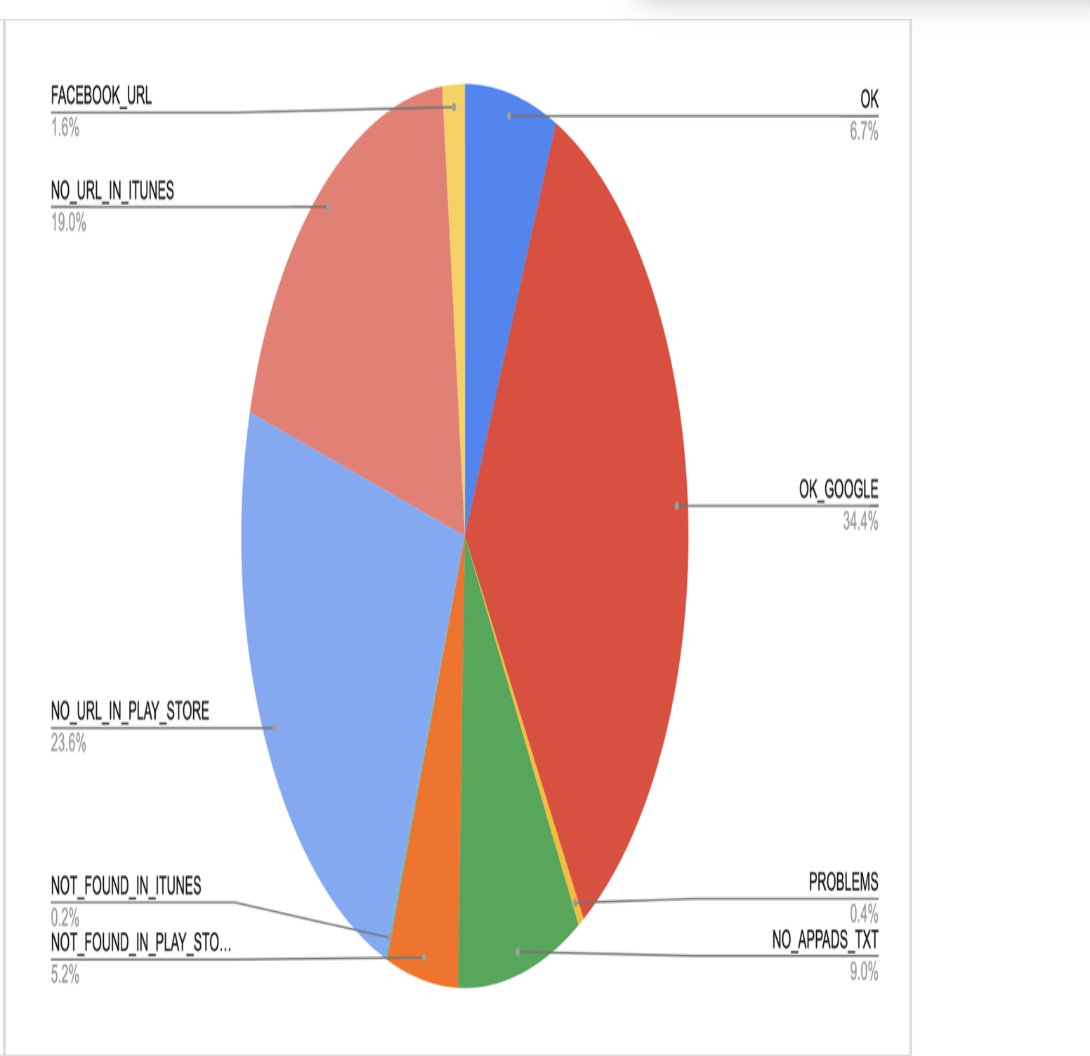
    This gives a good sample:

    Result code Count
    OK 5,693
    OK_GOOGLE 29,330
    PROBLEMS 361
    NO_APPADS_TXT 7,653
    NOT_FOUND_IN_PLAY_STORE 4,417
    NOT_FOUND_IN_ITUNES 134
    NO_URL_IN_PLAY_STORE 20,112
    NO_URL_IN_ITUNES 16,168
    FACEBOOK_URL 1,378
    BAD_DEV_URL 4

    Summary of findings

    It appears that due to not very high adoption of this standard at present (developer URLs not present in App Stores or app-ads.txt file not present on the developer domain), there is not much utility to it at the moment. However, as the adoption rate is increasing (see below), this is worth revisiting again. Also, consider that for this exercise we only used bids information – that is, not the sample of full traffic, but just what we have bid on. This may not be representative of the entire traffic also, and may be interesting to explore.

    Consider also that the developer may well have the app-ads.txt file on the website, but if the website is not properly listed in the app store, we have no way of getting to it (yet SSPs may include those sites in their overall numbers, see, e.g., MoPub below).

    What does the industry say?

    • Google Play Store is reported to have only ~8% adoption. Worth quoting here is this section of the report: 


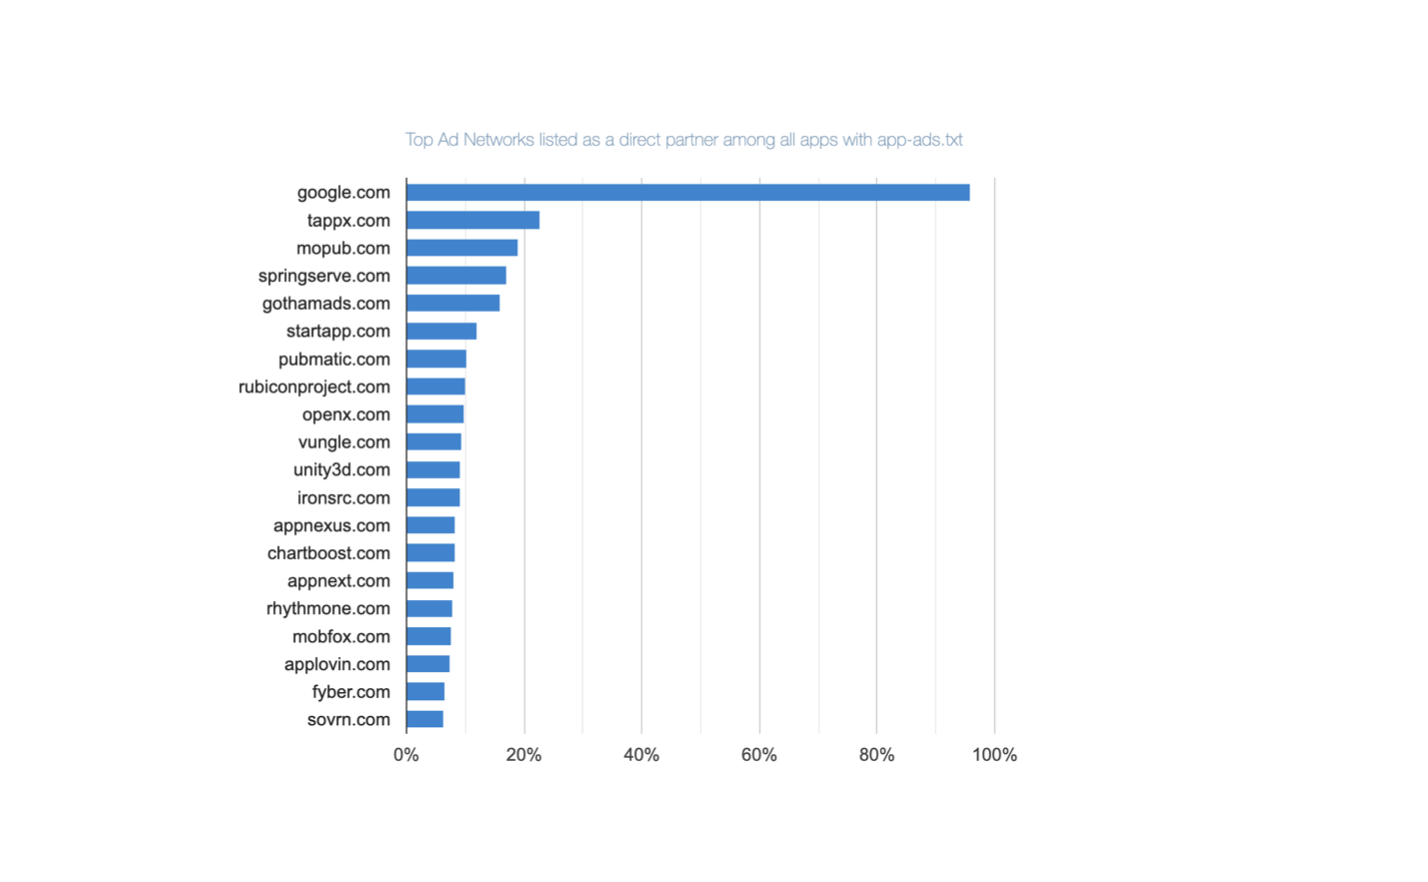
      Who Are the Top ‘Direct’ Ad Partners Inside the App-Ads.txt in Google Play Apps?
      Direct ad partners are those which have been granted direct permission by app developers to sell app ad space. That is, they are explicitly listed on the app’s “App-ads.txt” file. Google.com is listed as a direct ad partner on 95.87% of all “App-Ads.txt” files for Google Play apps. This makes it the most frequently mentioned direct ad partner for apps available on the Google Play.

    • Pixalate’s 2019 app-ads.txt trends report is interesting: 
      • Doesn’t seem that app-ads.txt makes that much difference for IVT (invalid traffic) – apps with app-ads.txt have 18.7% of IVT vs 21.1% for those without (pg. 6), despite Pixalate dramatizing this 2.4 percentage point increase as a 13% increase (2.4/18.7 – lies, damn lies and statistics).
      • It lists way higher numbers of adoption for Google Play Store apps than above but that is across top 1K apps.
      • Increasing rates of adoption (~65% rise in Q4 2019 – pg.13)
      • Unity, Ironsource, MoPub, Applovin, Chartboost – in that order – are in the top direct ad partners for Android apps (pg.18); MoPub, Unity, IronSource – in top direct AND resellers for iOS (pg.20)
    • MoPub claims that “app-ads.txt file adoption exceeds 80% for managed MoPub publishers”. It’s unclear what the qualifier “managed” means. Sampling our data, we have issues with app-ads.txt on MoPub about 48% in total, breaking down as follows: 
      • No app-ads.txt: 11%
      • No developer URL found in store: 22.5%
      • Not found in app store: 13.7%

    Not found?

    Additionally, it is worth looking at the bundles that are flagged as NOT_FOUND_IN_PLAY_STORE or NOT_FOUND_IN_ITUNES – how come those cannot be found?

    This does not have to be something nefarious, for example, based on spot-checking, it can be due to:

    • Case-sensitivity. Play Store bundles are case-sensitive but an SSP may normalize them to lower case when sending (e.g., com.GMA.Ball.Sort.Puzzle becomes com.gma.ball.sort.puzzle)
    • Some mishap like non-existent com.rlayr.girly_m_art_backgrounds being sent (but com.instaforall.girly_m_wallpapers exists)

    But even if the majority of the NOT_FOUND errors are due to such discrepancies, not fraud, it means that currently app-ads.txt mechanism itself is de facto not very reliable.

    Some other results

      • Q: Are there any apps that present as different publishers on the same SSP?
      • A: Not too many (about 8.6%), but even so for most important apps it is at most 2-3 – and even at long tail the max is 10 publisher IDs. This, though, can still account for some app-ads.txt PROBLEMs as seen above)


    Related documents, standards and initiatives

Swagger as you Go

As someone who offers a REST API, we at Romana project wanted to provide documentation on it via Swagger. But writing out JSON files by hand seemed not just tedious (and thus error-prone), but also likely to result in an outdated documentation down the road.

Why not automate this process, sort of like godoc? Here I walk you through an initial attempt at doing that — a Go program that takes as input Go-based REST service code and outputs Swagger YAML files.

It is not yet available as a separate project, so I will go over the code in the main Romana code base.

NOTE: This approach assumes the services are based on the Romana-specific REST layer on top of Negroni and Gorilla MUX. But a similar approach can be taken without Romana-specific code — or Romana approach can be adopted.

The entry point of the doc tool for generating the Swagger docs is in doc.go.

The first step is to run Analyzer on the entire repository. The Analyzer:

  1. Walks through all directories and tries to import each one (using Import()). If import is unsuccessful, skip this step. If successful, it is a package.
  2. For each *.go and *.cgo file in the package, parse the file into its AST
  3. Using the above, compute docs and collect godocs for all methods

The next step is to run the Swaggerer — the Swagger YAML generator.

At the moment we have 6 REST services to generate documentation for. For now, I’ll explicitly name them in main code. This is the only hardcoded/non-introspectable part here.

From here we, for each service, Initialize Swaggerer and call its Process() method, which will, in turn, call the main workhorse, the getPaths() method, which will, for each Route:

  1. Get its Method and Pattern — e.g., “POST /addresses”
  2. Get the Godoc string of the Handler (from the Godocs we collected in the previous step)
  3. Figure out documentation for the body, if any. For that, we use reflection on the MakeMessage field — the mechanism we used for sort-of-strong-dynamic typing when consuming data, as seen in a prior installment on this topic.

This is pretty much it.

As an example, here is Swagger YAML for the Policy service.

See also

Building on Gorilla Mux and Negroni

The combination of Negroni and Gorilla MUX is a useful combination for buildng REST applications. However, there are some features I felt were necessary to be built on top. This has not been made into a separate project, and in fact I doubt that it needs to — the world doesn’t need more “frameworks” to add to the paralysis of choice. I think it would be better, instead, to go over some of these that may be of use, so I’ll do that here and in further blog entries.

This was borne out of some real cases at Romana; here I’ll show examples of some of these features in a real project.

Overview

At the core of it all is a Service interface, representing a REST service. It has an Initialize() method that would initialize a Negroni, add some middleware (we will see below) and set up Gorilla Mux Router using its Routes. Overall this part is a very thin layer on top of Negroni and Gorilla and can be easily seen from the above-linked source files. But there are some nice little features worth explaining in detail below.

In the below, we assume that the notions of Gorilla’s Routes and Handlers are understood.

Sort-of-strong-dynamic typing when consuming data


While we have to define our route handlers as taking interface{} as input, nonetheless, it would be nice if the handler received a struct it expects so it can cast it to the proper one and proceed, instead of each handler parsing the provided JSON payload.

To that end, we introduce a MakeMessage field in Route. As its godoc says, “This should return a POINTER to an instance which this route expects as an input”, but let’s illustrate what it means if it is confusing.

Let us consider a route handling an IP allocation request. The input it needs is an IPAMAddressRequest, and so we set its MakeMessage field to a function returning that, as in


func() interface{} {
    return &api.IPAMAddressRequest{}
}

Looks convoluted, right? But here is what happens:

The handlers of routes are not called directly, they are wrapped by wrapHandler() method, which will:

  1. Call the above func() to create the pointer to IPAMAddressRequest
  2. Use the unmarshaller (based on Content-Type) to unmarshal the body of the request into the above struct pointer.

Voila!

Rapid prototyping with hooks

Sometimes we prototype features outside of the Go-bases server — as we may be calling out to various CLI utilities (iptables, kubectl, etc), it is easier to first ensure the calls work as CLI or shell scripts, and iterate there. But for some demonstration/QA purposes we still would like to have this functionality available via a REST call to the main Romana service. Enter the hooks functionality.

A Route can specify a Hook field, which is a structure that defines:

  • Which executable to run
  • Whether to run it before or after the Route‘s Handler (When field)
  • Optionally, a field where the hook’s output will be written (which can then be examined by the Handler if the When field is “before”). If not specified, the output will just be logged.

Hooks are specified in the Romana config, and are set up during service initialization (this is in keeping with the idea that no Go code needs to be modified for this prototyping exercise).

Then during a request, they are executed by the wrapHandler() method (it has been described above).

That’s it! And it allows for doing some work outside the server to et it right, and only then bother about adding the functionality into the server’s code.

If this doesn’t seem like that much, wait for further installments. There are several more useful features to come. This just sets the stage.

IDRing

A major feature of the Romana Project is topology-aware IPAM, and an integral part of it is the ability to assign consecutive IP addresses in a block (and reuse freed up addresses, starting with the minimal).

Since IPv4 addresses are essentially 32-bit uint, the problem is basically that of maintaining a sequence of uints, while allowing reuse.

To that end, a data structure called IDRing was developed. I’ll describe it here. It is not yet factored out into a separate project, but as Romana is under Apache 2.0 license, it can still be reused.

  • The IDRing structure is constructed with a NewIDRing() method, that provides the lower and upper bound (inclusive) of the interval from which to give out IDs. For example, specifying 5 and 10 will allow one to generate IDs 5,6,7,8,9,10 and then return errors because the interval is exhausted. 

    Optionally, a locker can be provided to ensure that all operations on the structure are synchronized. If nil is specified, then synchronization is the responsibility of the user.

  • To get a new ID, call GetID() method. The new ID is guaranteed to be the smallest available.
  • When an ID is no longer needed (in our use case — when an IP is deallocated), call ReclaimID().
  • A useful method is Invert(): it returns an IDRing whose available IDs are the ones that are allocated in the current one, and whose allocated ones are the available ones in the current one. In other words, a reverse of an IDRing with min 1, max 10 and taken IDs from 4 to 8 inclusively is an IDRing with the following
    available ranges: [1,3], [9,10].
  • You can see examples of the usage in the test code and in actual IP allocation logic.
  • Persisting it is as easy as using the locker correctly and just encoding the structure to/decoding it from JSON.

Kabuta: GoClipse meets Delve

I am addicted to having good development tools, specifically, I like my debuggers visual. Once I was so annoyed by inability to debug a common use case of calling a PL/SQL stored procedure from Java, I made it into a single-stack cross-language debugger project, for example.

And I’m also a fan of Eclipse (well, see above).

So when Romana went with Go (pun definitely intended) as our language of choice, I quickly found GoClipse, and it was nice.

But then I learned about Delve and I wanted to have the best of both worlds — the functionality of Delve and the graphics of GoClipse.

So here’s an idea… Eclipse (from which GoClipse is, obviously, derived) understands GDB/MI, and can represent it visually. So all that remains is to adapt Delve’s API to GDB/MI.

And so I started it as a Kabuta project. Let’s hope I don’t abandon it…

OpenDSP’s DMP: Nanoput

Here I will describe the Nanoput project, which comprises a large part of OpenDSP’s DMP (Data Management Platform). There are, of course, other pieces — the entire picture will be painted under the DMP tag.

Overall DMP stack is as follows:

  • Nanoput proper: NGINX with Lua to handle . I’ll confess that at the moment this is a bit of a pet (as in not cattle). We are considering using OpenResty instead of rolling our own, which uses parts of OpenResty. But no matter, here I will present some features that can be achieved with this setup — and one instance is capable of handling all this.
  • Redis for storing and manipulating user sets — ZSET is great
  • MySQL for storing metadata — will be described in a separate post
  • PHP/JS for a simple Web interface to define the said metadata
  • Python for translating metadata into the configuration for NGINX
  • AWS S3 for storing raw logs — pre-partitioned so that EMR can be used easily.

Conceptual introduction

Conceptually, let’s consider the idea of an “event”. An impression, a conversion, a video tracking event, a site visit, etc, is an event — anything that fires a request to our Nanoput is. You may recognize a similarity with Snowplow — and that is because we are solving a similar problem.

To proceed further, I must ask of a little indulgence — please bear with me. As a technologist, it really grated me to hear the words like “Javascript pixel” but I have learned to stop worrying and love the bomb. Therefore, Javascript pixel it is when it is a JS code that fires some GET URLs. Now, then, the requests are assumed to be fired as GET HTTP requests (do not have to be but that’s the primary idea behind Nanoput per se — management of metadata to ingest things via other means, like FTP upload, etc, will be addressed separately) and can originate, for example, from:

  • Exchanges or DMPs, as an exchange-initiated cookie-sync: see below.
  • Regular user behavior — impressions, in case of video, video-tracking events; conversions
  • Calls as if initiated by exchanges or DMPs to Nanoput but in reality are, heh, Javascript pixels

Now, let us also consider the idea of a “user segment”. If you think about it, a segment is just a set of users. Thus, we may as well consider a user that produced a certain event as belonging to some segment. These may be explicitly asked for, such as “users we want to retarget“, or “users who converted”, etc. But there is no reason why any event cannot be defined as a segment-defining one.

Segments, here, are a special case of data collections concept discussed in a different post.

Given that, we can now dive into Nanoput implementation

General data acquisition idea

Here, we simply leverage basic NGINX functionality, that is logging. To that end, we split the main config file into sections that we include that deal with log format and location and behavior.

Static data acquisition URLs

By “static”, here we mean common use cases that are just part of Nanoput (hence the “man” subdirectory you will notice in examples — stands for, just like the Unix man command, for “manual”). Here we have:

  • Site events (essentially, those are an extension of retargeting concept).
  • Standard event tracking — by which we mean, standard events that happen in Ad world.

Notice that we also augment information available from NGINX (HTTP headers, etc.) with geo data using GeoIP module and user-agent/device/OS

Dynamic (metadata-driven) data acquisition URLs

Dynamic data acquisition works simply: a process reads the metadata table and creates appropriate entries in the NGINX configs that define log format and location and behavior.

Creating “segments”

On every “event”, consider script. We use awesome Redis’s Sorted Set functionality here inserting things twice. The key idea here, again, is a variation on dealing with data gravity concerns by just duplicating storage. We create two sorted sets for each key, the “score” being the first and last time we have seen the user. The reasoning for this is that:

  • First-seen: we can write batch scripts to get rid of users we have last seen over X days ago (expiring targeting).
  • Last-seen: helps us with conversion attribution (yes, this assumes naive last-click attribution or variants.

Duplication is not just for every user — it is for every set. The key here is the set (or segment) name, and the value is the set of users.

An added benefit of this is that new segments can be created by using various Redis set operations (union, intersection) easily.

Some useful shortcuts for a DMP

  • Getting OS/browser info without necessarily using WURFL (though that can easily be fronted by NGINX too, actually).

Exchange cookie sync

In the display world, there is a need for cookie syncing between DSP and a third-party DMP or an exchange/SSP, and that can be either exchange, DMP or DSP-initiated, or both. Some exchanges may allow the redirect chain to proceed further, some may not. Nanoput provides this functionality for exchanges we deal with as well as a template for doing it for other partners — at the speed that NGINX provides. Here are the moving parts:

Storing for further analysis

Raw logs, formatted as above, are uploaded to S3. Notice that they are stored twice, with different partitioning schema. This is one of the key ideas in Nanoput — storage is cheap; duplicating the storage this way and then using one or another partitioning schema depending on the use case:

Cookies coming home to Proust

Ok, I couldn’t resist the title, and also too, Billy Collins’ line about “No cookie nibbled by a French novelist could send one into the past more suddenly” is just awesome so why not… But I digress…

At OpenDSP, we, obviously, cookie (yes, it is a verb — to cookie) users. While more details can be had in other posts (such as Nanoput, and more under DMP tag), here I’ll just address the format issue.

The cookies we use are known as mod_uid cookies because of the Apache project. (A good writeup is done here). Because we use NGINX, and, consequently, use its uid_set/uid_get functionality, one may be puzzled when reconciling the cookie as seen sent to the user and what NGINX writes in its logs. So here

Thinking outside the box — and in a sandbox

Give engineers the same problem, they all will come with roughly the same solution. But I am proud to actually have invented a different one.

Many systems, such as ad servers, RTB bidders, DSPs, etc., store the business rules (targeting, pacing, etc.) information that a user manipulates via UI in some sort of database (likely RDBMS), and then probably transform it into some sort of fast lookup for the real-time decision making. Seems straightforward.

At OpenDSP we went for a new approach which I believe is quite powerful. Simply put, we compile the rules from DB into a Groovy script (well, a set of Groovy scripts). Given that Groovy compiles to JVM bytecode, essentially we create concrete subclasses conforming to the following interfaces and using the following abstract classes:

  • For ads, that is, targeting, implementing Ad interface and subclassing AdImpl
  • For creatives, implementing Tag interface and subclassing TagImpl
  • Finally, there is BidPriceCalculator interface, which will be described below. This is not auto-generated.

A script that compiles the DB rules into the scripts is triggered by the UI whenever anything is saved, and the Lot49 process will reload any changed scripts every so often (e.g., 5 minutes).

Generally, the algorithm is as follows: During a request, the system will take the OpenRTB bid request and augment it with various data (e.g., geo lookup, information on user, etc). It will then, for each Ad, call its canBid1() and checkSegments() methods (both must return true). canBid1() is called first, to filter out quickly those ads that won’t bid based on the data already available in the request, before we augment it with data that needs to be fetched from a user cache; after that, checkSegments() will be called on the remaining candidates. In turn, canBid1() will call the canBid() methods of all Tags, to check which, if any, creatives fit this bid request (based on media type, size, video duration if applicable, etc.)

Finally, the price is determined based on pacing and budget settings, unless the appropriate BidPriceCalculator is found for an Ad, in which case it is used to get the bid price.

The resulting scripts are essentially a bunch of getters based on the rules in the DB, and the abstract classes implementing the interfaces are just a bunch of if/then statements using those getters. So, what is the advantage of this rather than just reading rules from the DB?

The advantage is that any part of the generated script can be modified manually for custom targeting and/or bid pricing based on some model. These scripts may be edited by data scientists independently, eliminating the need for engineers to translate data scientists’ models into code! All the data that the model needs will be provided in the arguments to the appropriate methods; just implement the interface in Groovy, and you’re done!

It is important that all data is provided in the input, so the scripts do not need to concern themselves with high-latency fetching of data from somewhere. It is also safe, even if the data scientist makes a mistake. Consider: because we run in JVM, we can take advantage of the Java security model and create our own SandboxSecurityManager to prohibit network calls, harmful calls such as System.exit(), only allow it to call helpers from certain packages, etc.

One caveat, however: security model is not much help for other harmful things such as recursion or infinite loops. The idea, however, is to solve those as follows (about which we’ll talk in a later post):

  • Recursion: by using static analysis on the loaded code
  • Loops: either by doing the same and prohibiting loops completely, or, if undesirable, by observing which scripts run longer than some time and blacklisting those that exceed the threshold.

Let’s look at some examples:

  • Here is an Ad targeting US and one of the segments, “386:fp:236” or “387:fp:236”.

    Quick note: “fp” here indicates it is a first-party segment; for more information on how these are created and managed securely in a multi-tenant environment, see Nanoput and other articles on our DMP elsewhere on this blog.

  • A creative for this ad is a 300×250 banner. Notice the convention of how the ID of the Ad is included in the name of the Tag. This is for demonstration purposes, and thus a lot of code is unrolled here; in reality, methods like getClickRedir() or getTagTemplate() would just be used from the TagImpl class
  • Finally, BidPriceCalculator (you can see it is defined in the Ad). As can be seen, it uses a formula based on a segment score and a viewability score from Integral to come up with a price. (This, of course, is just an example.) Notice that the information about the user’s score, which is part of the DS-built model, and Viewability score are part of the augmented request that is the argument to getBidPrice() method. In other words, as noted above, the code here needs to just execute a formula, and all the data will be provided to it; this allows us to sandbox this code for safety while allowing for flexibility.

Pretty cool, if I may say so myself.

P.S. You may feel free to contrast this approach with Xandr’s Bonsai.


Music of the post: Feeling groovy

A post-mortem of a project: Wildboard

Once upon a time, I was working at Snaplogic, and at that time its office was in downtown San Mateo. Pretty much across the street from a great coffee shop, Kaffeehaus.

If you’ve been there, or even if you just looked at the website, you’d realize that the owner put quite an effort into it being a Viennese-style coffee house, with all the interior design decisions that go with it.

Now, a local coffee shop is often a place where people expect to post some local notices and ads (“lost dog”, “handyman available”, “local church choir concert”, etc). And here’s a conundrum. A simple cork bulletin board with a bunch of papers pinned to it just did not seem to fit the overall mood/interior/decor of the cafe:

Yet the cafe does want to serve local community and become an institution.

This being Silicon Valley, Val, the Kaffeehaus owner, had a vision — what about a virtual board, as a touch-screen.

The name was quickly chosen to be Wildboard — because it is, well, a bulletin board and in honor of the boar’s head that is prominently featured on the wall:

.

A multi-touch-based virtual bulletin board sounded interesting. Most touch-screen kiosks I’ve seen so far — in hotels and malls, for instance, or things like ImageSurge — only allow tap, not true multi-touch. (To be honest, multi-touch may or may not be useful — but see below and see also P.S. — but it is a very nice “pizzazz”).

And we — that is, myself and Vio — got to work. And in short order we had:

  • Fully multi-touch (with rotation, zoom, etc) web UI — as a Windows 8 CSS/Javascript app (source).
  • Wildboard “board server” — a Python app running on the same computer as the UI. It is responsible for polling the web server (below) and serving information to the UI (source).
  • Wildboard web server — a PHP app based on an existing web classified application(source). This allows users to submit ads (or they can do it via a mobile app, as below). It is also modified to automatically create QR codes based on user-provided information (map, contact, calendar, etc) and adds them to an ad.
  • Wildboard mobile app — PhoneGap/Cordova based app for both Android and iPhone (source)
    This app allows one to:

    • Post an ad
    • Scan an ad’s QR code
    • And, finally, for the “Wow!” effect during the demo, one can drag an ad from the screen into the phone. Here it is, in action:

  • Wildboard orchestrator — a Node.js app (source) designed to coordinate interactions between the mobile app and the board. It is the one that is determines which mobile app is near which board and orchestrates the fancy “drag” operation shown above.
  • For more information, check out spec and the writeup.

Charismatic Val somehow managed to get a big touch screen from Elo Touch. Here’s how it fit in the decor:

A network of such bulletin boards, allowing hyper-local advertising, seems like a good idea. Monetization can be done in a number of ways:

  • Charging for additional QR codes — e.g., map, contact, schedule.
  • Custom ad design (including interactive and advanced multimedia features — sound, animation, video).
  • A CPA (cost-per-acquisition) model, while tracking interaction via an app — per saved contact, per scheduled appointment, per phone call.
  • Premium section.

But… alas… This is as far as we got.

P.S. One notable exception is a touch-screen showing suggestions in Whole Foods in Redwood City.

OpenDSP – stay tuned

Every marketer, it seems, wants to participate in real-time bidding (RTB). But what is it that they really want?

They want an ability to price (price, not target!) a particular impression in real-time. Based on the secret-sauce business logic and data science. Fair enough.

But that secret sauce, part of their core competence, is just the tip of the iceberg — and the submerged part is all that is required to keep that tip above water. To wit:

  • Designing, developing, testing and maintaining actual code for the UI for targeting, the bidder for bidding, reporting, and data management
  • Scaling and deploying such code in some infrastructure (own data center,
    clouds like AWS, GCE, Azure), etc.
  • Integrating with all exchanges of interest, including the following steps:
    • Code: passing functional tests (understanding the exchange’s requirements for parsing request and sending response)
    • Infrastructure: ensuring the response is being sent to the exchange within the double-digit-millisecond limit
    • Scaling: As above, but under real load (hundreds of thousands of queries per second)
    • Business: Paperwork to ensure seat on the exchange, including credit agreements when necessary
  • Operations: Ongoing monitoring of the operations, including technical (increased latency) and business (low fill level, high disapproval level) concerns (whether these concerns are triggered by clients, exchange partners or,
    ideally, pro-actively addressed internally.

None of which is their core competence. We propose to address the underwater part. It’ll be exciting.

Enter OpenDSP. We got something cool coming up here. Stay tuned.

Watch this space, and by this space I mean this blog, this GitHub account.

Continuous integration with code coverage in Python

Update

This code has been integrated into the main tree.

I decided it would be good to have a coverage report of our Python code,
with nice visualization like Clover.

So I took Ron Smith’s PyAntTasks, and added py-cover task to them. This will run coverage for every test, and a cumulative one. In other words, you can see what code a particular test exercises, and what code all the tests in your tree exercise.

This also modifies py-test task to include packagedtests attribute – see below.

The newly added py-cover task runs Ned Batchelder’s coverage.py (download it separately), and is specified as follows in your build.xml:


Here, is a FileSet specifying tests to run, is a FileSet specifying source code to cover.
The attributes are:

  • reportsDir – where the coverage reports go
  • packagedtests – this idiosyncrasy is prompted by our tree setup. If this attribute is true it means that the test files reside in Python packages, false otherwise. (In our case, they do not; they are in the tree but are not packages. Note that the original py-test task assumed they are in packages, I have changed this too).
  • coverage – path to coverage.py on your system (which you downloaded separately, right?)

P.S. I know about the colorize.py thingie, but I rolled my own (uglier, of course) for this one.

XmlRpc for AS 3.0 HOWTO

Since people ask (in emails, at the short-lived MT version of this blog and on flexcoders@yahoo), here is how I use it.

DISCLAIMER: as I’ve mentioned, I hacked this from the original when I was just starting with Flex 2, so I gutted some code before I knew what the hell I was doing,
but in this state it works for me… 

I use Flex Builder. I have the contents of the zip file right in my Flex Builder project. (NOTE: This was before I read that flex should not be a part of a package name per Adobe’s license; change it, willya?)

Then I choose have a simple facade like so:

package com.qbf.flex.ct {
  // Insert correct imports here, of course...

  public class Utils {
    public static function serverCall(method:String, 
                                          params:Array,    
                                          handler:Function): void {
        SERVER_CALL.call(method, 
                         params, 
                         handler, 
                         DisplayObject(Application.application));
    }

    public static const SERVER_CALL:XmlRpcService = 
   new XmlRpcService("http://localhost:8081/", 
                        Application.application.url.indexOf("http://") == 0? null :
   null :
   // This is explained further below... 
   QbfFakeResponse.SINGLETON); 
}

And from everywhere else in the code I use Utils.serverCall() as
follows:

var params:Array = [{value : resdefDataToServer, type: "struct"}, 
uri, server];
Utils.serverCall("doStuff", params,
        // This callback will be executed when the server 
        // call returns
 function(result:Object):void {
           process(result);
        });

Notice that you only need to specify types for parameters if it’s not a string. If all your parameters are string, you can just pass an array of their values to the serverCall() –a little sugar…

Now about this QbfFakeResponse.SINGLETON business (it’s not necessary, just use null in its place if you don’t need it). The definition ofSERVER_CALL checks whether the application URL starts with http:// — in my case, it means that it’s running “for real”. If it is running in Flex Builder’s debugger, the URL will start with file://,
and so I will use “fake” responses to simulate server calls (this is sometimes useful for debugging, so that I don’t have to run a server). This fake response class is an implementation of com.qbf.flex.util.xmlrpc.FakeResponse interface. All you need to do is implement getResponse() method and return whatever you need by checking the method name and parameters provided.

Dbdb – a JPDA-based single-stack debugger for mixed-language programming

Dbdb project is officially up for adoption, because I have no plans for working on it (I am sick of it).

Dbdb is a proof-of-concept of a JPDA-based single-stack debugger for mixed-language programming, done as an Eclipse plugin (but doesn’t have to be). It is based on Java 6 (“Mustang”). The proof-of-concept is allowing a developer to debug Java code that calls a PL/SQL stored procedure. The debugging session in Java proceeds normally, nothing to write home about. When a Statement.execute() (or similar) statement is executed, however, the debugger connects to the Oracle’s VM and shows a combined call stack, from Java down into PL/SQL. (See screenshot). The idea, of course, that it can be done with other combinations, but Java-into-Oracle-stored-proc is a very common scenario.

P.S. This is a rehash of an older post. I am trying to see what Blogger is like vs. LJ (for instance, LJ breaks javablogs feeds).

That’s it, done…

That’s it, done!

Bassem (Max) Jamaleddine

 
Prof.Madden finally approved the latest version of Dbdb write-up, and so I am all set for my 10+-years-overdue degree. With that, I’ve updated the sourceforge project
with all the latest stuff from my workspace, including the docs on the page, Javadoc, code (and aforementioned docs also) in CVS, etc (even a screenshot).
Dbdb project is officially open for adoption, because I have no plans for working on it (I am sick of it). Fly, baby, fly…
P.S.

  • I have to see whether Pat and Spencer actually decided to use this one for the IDEA Plugin Contest… There’s still time…
  • Maybe I do want to augment it for use with GWT, so it automagically inserts a debugger; statement as the first
    line any native Javascript method… Just for kicks… Nah, it would be too slow…

What’s going on here?

Consider the following code:

MethodEntryEvent evt;
ObjectReference con;
...

Class evtClass = evt.getClass();
System.out.println("Class of evt: " + evtClass);
System.out.println("Methods of evt: " +
                Arrays.asList(evtClass.getMethods()));
try {
  Value v = evt.returnValue();
  System.out.println(v);
} catch (Throwable ex) {
  ex.printStackTrace();
}

try {
  java.lang.reflect.Method retvalMethod =
          evtClass.getMethod("returnValue", null);
  retvalMethod.setAccessible(true);
  con = (ObjectReference)retvalMethod.invoke(evt, (Object[])null);
} catch (Throwable t) {
  t.printStackTrace();
}
System.out.println("Returned: " + con);

When running, this code prints the following:

 Class of evt: class com.sun.tools.jdi.EventSetImpl$MethodExitEventImpl Methods of evt: [ public com.sun.jdi.Value com.sun.tools.jdi.EventSetImpl$MethodExitEventImpl.returnValue(),  public java.lang.String com.sun.tools.jdi.EventSetImpl$LocatableEventImpl.toString(),  public com.sun.jdi.Method com.sun.tools.jdi.EventSetImpl$LocatableEventImpl.method(),  public com.sun.jdi.Location com.sun.tools.jdi.EventSetImpl$LocatableEventImpl.location(),  public com.sun.jdi.ThreadReference com.sun.tools.jdi.EventSetImpl$ThreadedEventImpl.thread(),  public int com.sun.tools.jdi.EventSetImpl$EventImpl.hashCode(),  public boolean com.sun.tools.jdi.EventSetImpl$EventImpl.equals(java.lang.Object),  public com.sun.jdi.request.EventRequest com.sun.tools.jdi.EventSetImpl$EventImpl.request(), public com.sun.jdi.VirtualMachine com.sun.tools.jdi.MirrorImpl.virtualMachine(),  public final native java.lang.Class java.lang.Object.getClass(),  public final void java.lang.Object.wait(long,int) throws java.lang.InterruptedException,  public final void java.lang.Object.wait() throws java.lang.InterruptedException,  public final native void java.lang.Object.wait(long) throws java.lang.InterruptedException,  public final native void java.lang.Object.notify(),  public final native void java.lang.Object.notifyAll()] java.lang.NoSuchMethodError: com.sun.jdi.event.MethodExitEvent.returnValue()Lcom/sun/jdi/Value; at org.hrum.dbdb.DriverManagerMethodExitEventListener.process(DriverManagerMethodExitEventListener.java:99) at org.hrum.dbdb.DbdbEventQueue.removeDebug(DbdbEventQueue.java:168) at org.hrum.dbdb.DbdbEventQueue.remove(DbdbEventQueue.java:47) at org.eclipse.jdt.internal.debug.core.EventDispatcher.run(EventDispatcher.java:226) at java.lang.Thread.run(Thread.java:619) Returned: instance of oracle.jdbc.driver.T4CConnection(id=435)(class com.sun.tools.jdi.ObjectReferenceImpl) 

Now, I will run this in debug mode and set a breakpoint at the red line above. When the breakpoint is hit, evaluation of evt.returnValue() returns an instance of com.sun.tools.jdi.ObjectReferenceImpl. However, when the execution is resumed, the result is as above (that is, evt.returnValue() results in a NoSuchMethodError).

Further, if we remove the green line (retvalMethod.setAccessible(true);), we will get an IllegalAccessException on the invocation:

Class org.hrum.dbdb.DriverManagerMethodExitEventListener can not access a member of class com.sun.tools.jdi.EventSetImpl$MethodExitEventImpl with modifiers “public”

What is going on?

I’d say it’s left as an exercise for the reader, but honestly, at the moment, I don’t feel like looking for an answer at all. I will perhaps let Bob and Dr. Heinz Max Kabutz (did I mention how much I enjoy referring to Dr.Heinz Max Kabutz?) to do the detective work…


ENVIRONMENT: This code is part of a plug-in project I am running in Eclipse 3.2RC3, with Mustang.

ProxyPlus?

I am backdating this entry, so I don’t remember quite what this was about…

E-mailed Shane:

Hi,

I am working on a project that necessitates precisely what you describe — Proxies of classes, not just interfaces. So thank you, that I, apparently, don’t have to delve into BCEL (I will let you know about the project when I have a bit more to show than I do now).

However, I’m a bit confused. In a description at http://www.gnufoo.org/java/java.html you point to your
junit.extensions.jfunc.util.ProxyPlus class, but it does not exist in the jcfe.jar I got from http://www.gnufoo.org/jcfe/, nor does it exist in the jfunc project. Where should I look for this functionality?

Thanks.

Got a bounce. So, for now, will do with explicit org.hrum.dbdb.JDBCDriverFactory‘s mechanism of going through drivers loaded, deregistering them and registering, in their stead, org.hrum.dbdb.DbdbDriver‘s that delegate to the registered drivers.

P.S. This is what P6Spy does