Anatomy of a Fork Explosion, Part II: The Full Dissection

Two days ago we published a quick look at OpenClaw’s fork explosion — 34,600 forks, sampled from the bookends of GitHub’s API, with a 33,000-fork black hole in the middle. We were upfront about it: “This was a 30-minute investigation, not a thesis.”

This is the thesis.

We went back and scraped all 36,915 forks (the number grew while we were counting). Every single one. Plus 9,423 pull requests. Three graphs, no black holes, no excuses.

Graph 1: The hockey stick that wasn’t quite a hockey stick

Forks per day

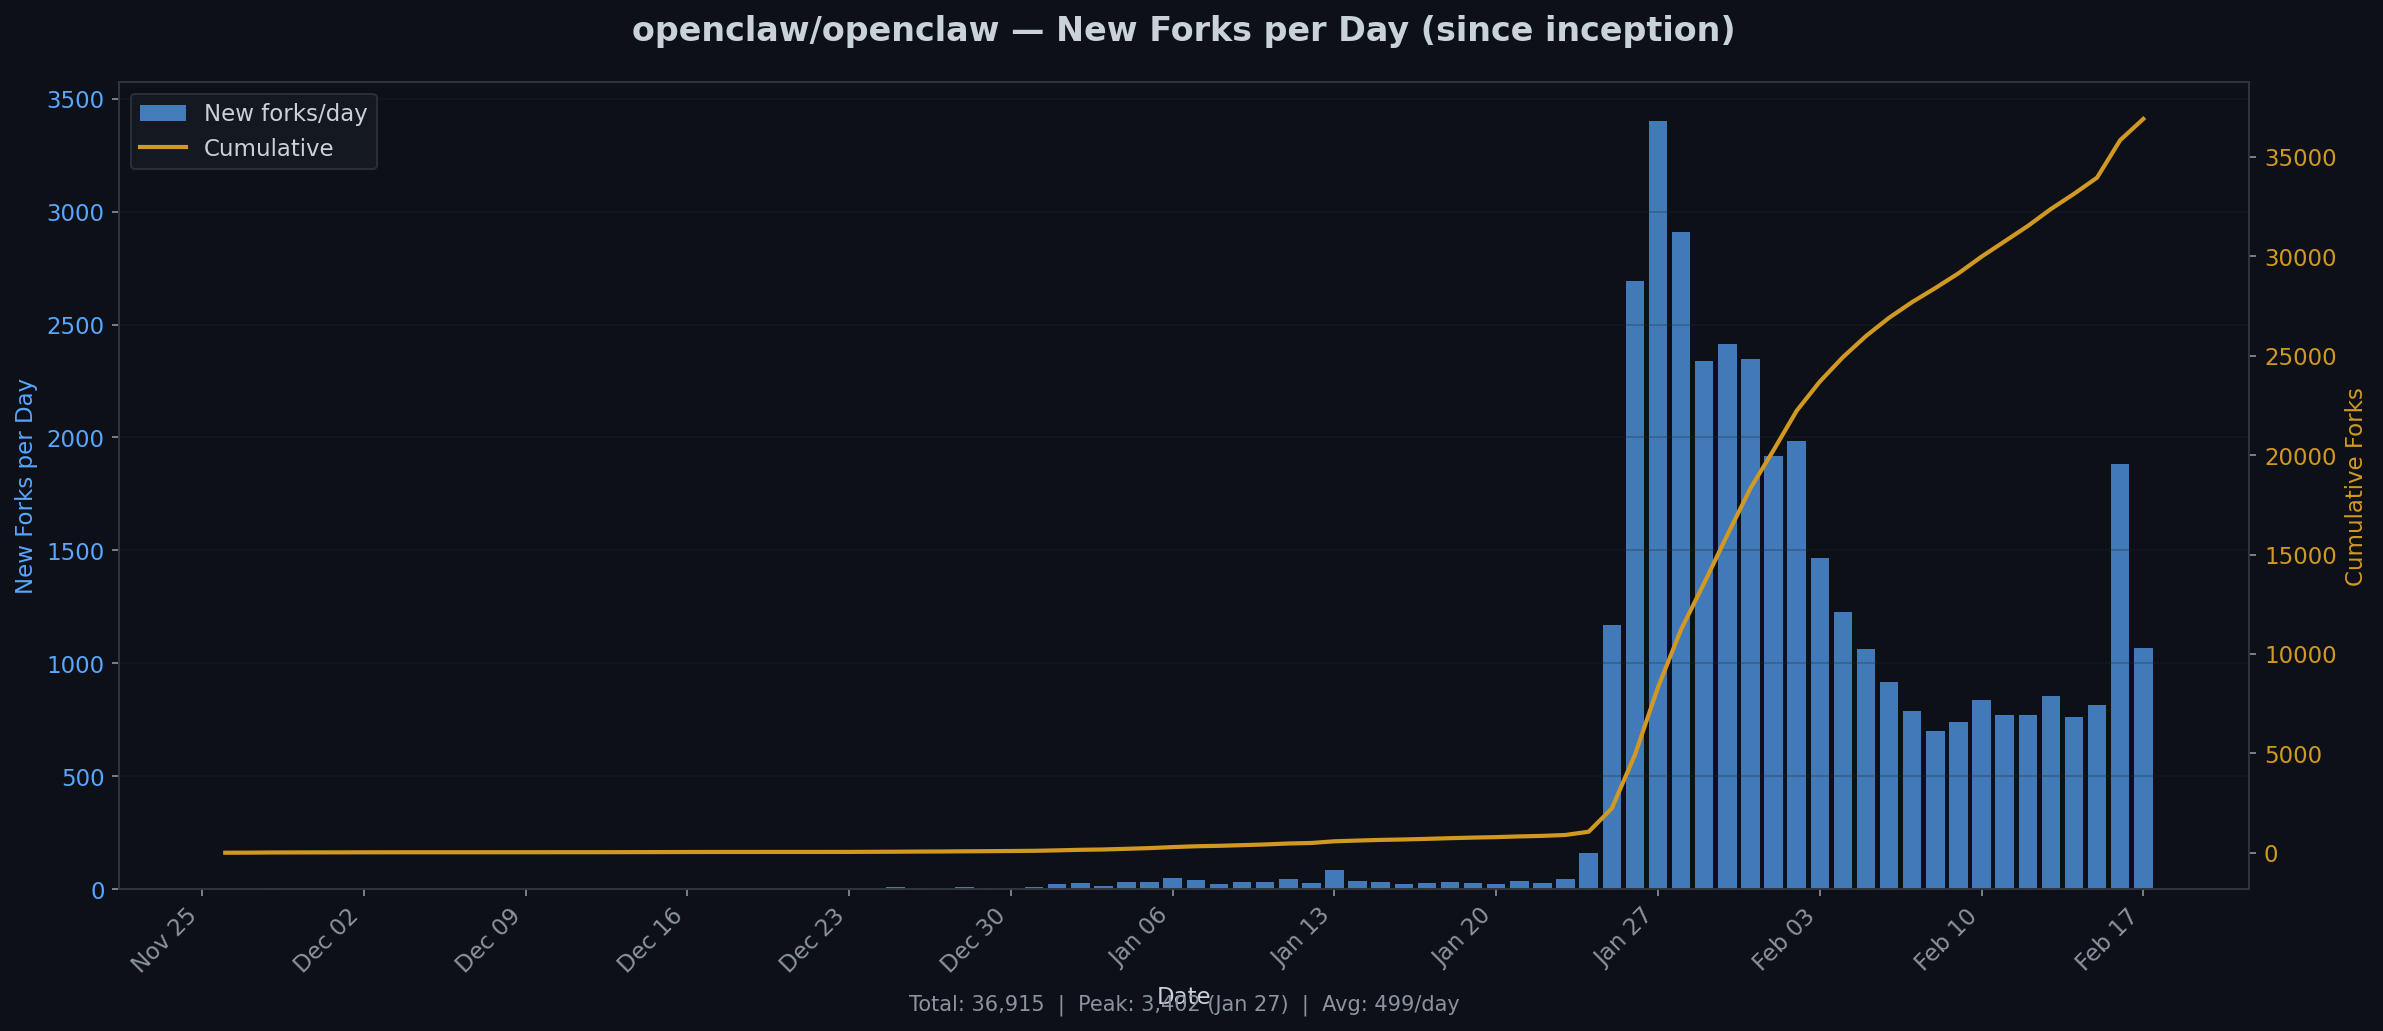
36,915 total forks. Peak: 3,402 on January 27. Average: 499/day.

The first fork appeared November 26, 2025. For nearly two months: nothing. A handful of early adopters per day, the kind of people who read Hacker News at 2am and clone things “to look at later.”

Then something happened around January 20.

Daily forks went from ~50 to over 1,000 in three days. By January 27, it hit 3,402 in a single day. That’s one fork every 25 seconds, sustained for 24 hours.

But here’s what the full data shows that the sample didn’t: it’s already declining. The peak was January 27. By mid-February, we’re down to about 1,000/day — still enormous, but the exponential phase lasted exactly one week. What we’re in now is the long tail. The viral moment came, the viral moment is going.

The cumulative curve tells the same story: a flat line, a vertical cliff, and then an inflection into deceleration. Classic viral adoption. The question isn’t whether it will keep growing — it will. The question is whether it levels off at 40,000 or 400,000.

Graph 2: Who actually builds anything?

Forks with commits

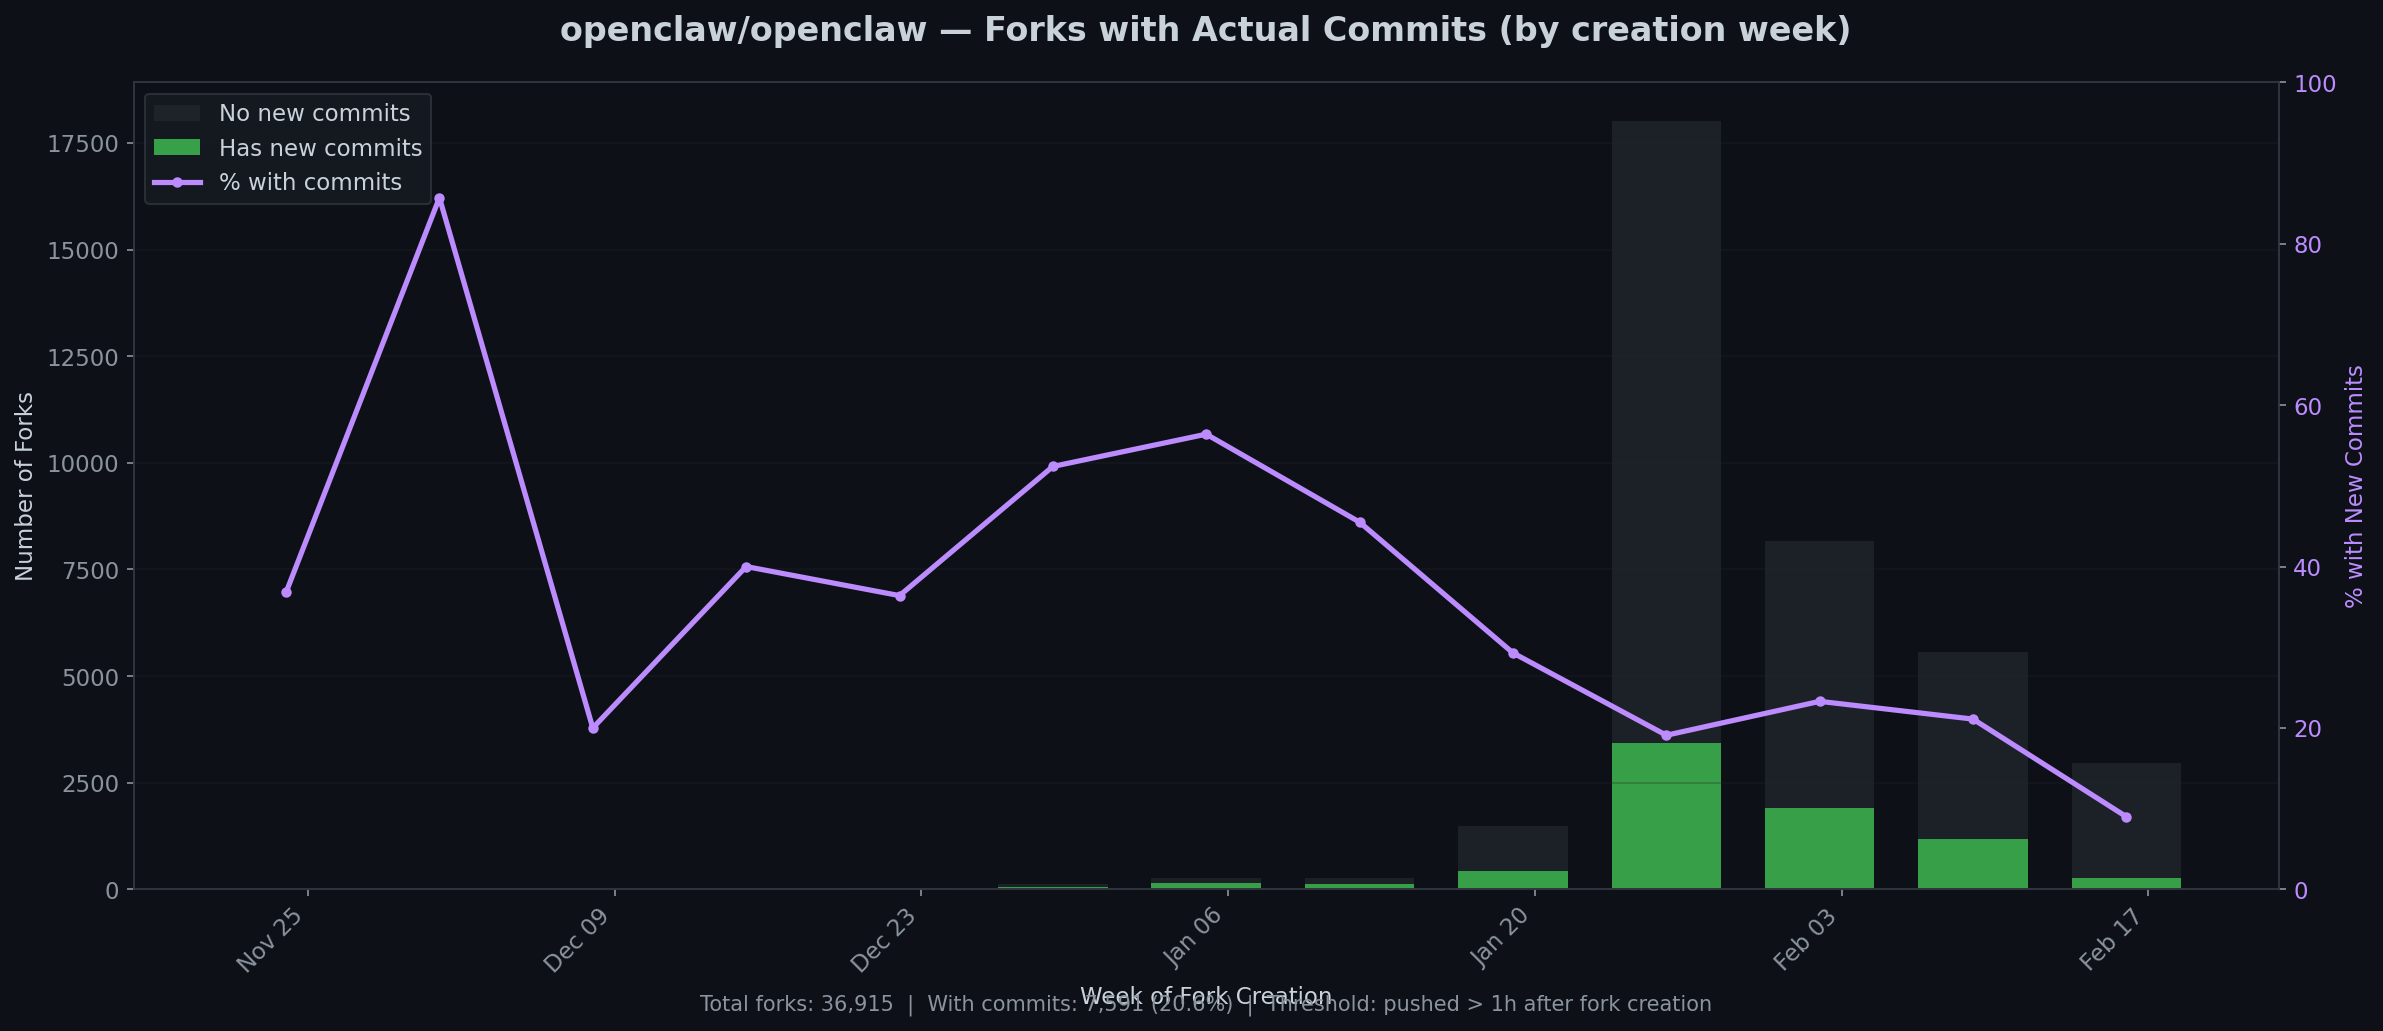
7,591 of 36,915 forks (20.6%) have new commits. Threshold: code pushed more than 1 hour after forking.

This is the graph that matters.

In the early days — November, December — the commit rate was absurd. 60-90% of forks showed real work. These were people who forked because they intended to build. Small community, high signal.

Then came January’s tidal wave, and the ratio cratered. At peak volume, only about 10-20% of forks have any commits at all. The rest are what they’ve always been: GitHub bookmarks. One click, zero intention.

But zoom out from percentages and look at absolute numbers: even at 10%, that’s 300-500 people per day writing actual code on top of OpenClaw. The most recent week shows roughly 1,200 committed forks out of about 5,500 new ones. That’s a healthy project by any measure. It’s just a healthy project buried under 80% noise.

The trend line tells you something about open-source psychology: the harder a project is to use, the higher its commit rate. When OpenClaw was obscure, only competent developers found it. Now that it’s famous, everybody forks it and almost nobody builds anything. Same pattern as every framework that hits the front page of Reddit.

Graph 3: Who gives back?

PRs from forks

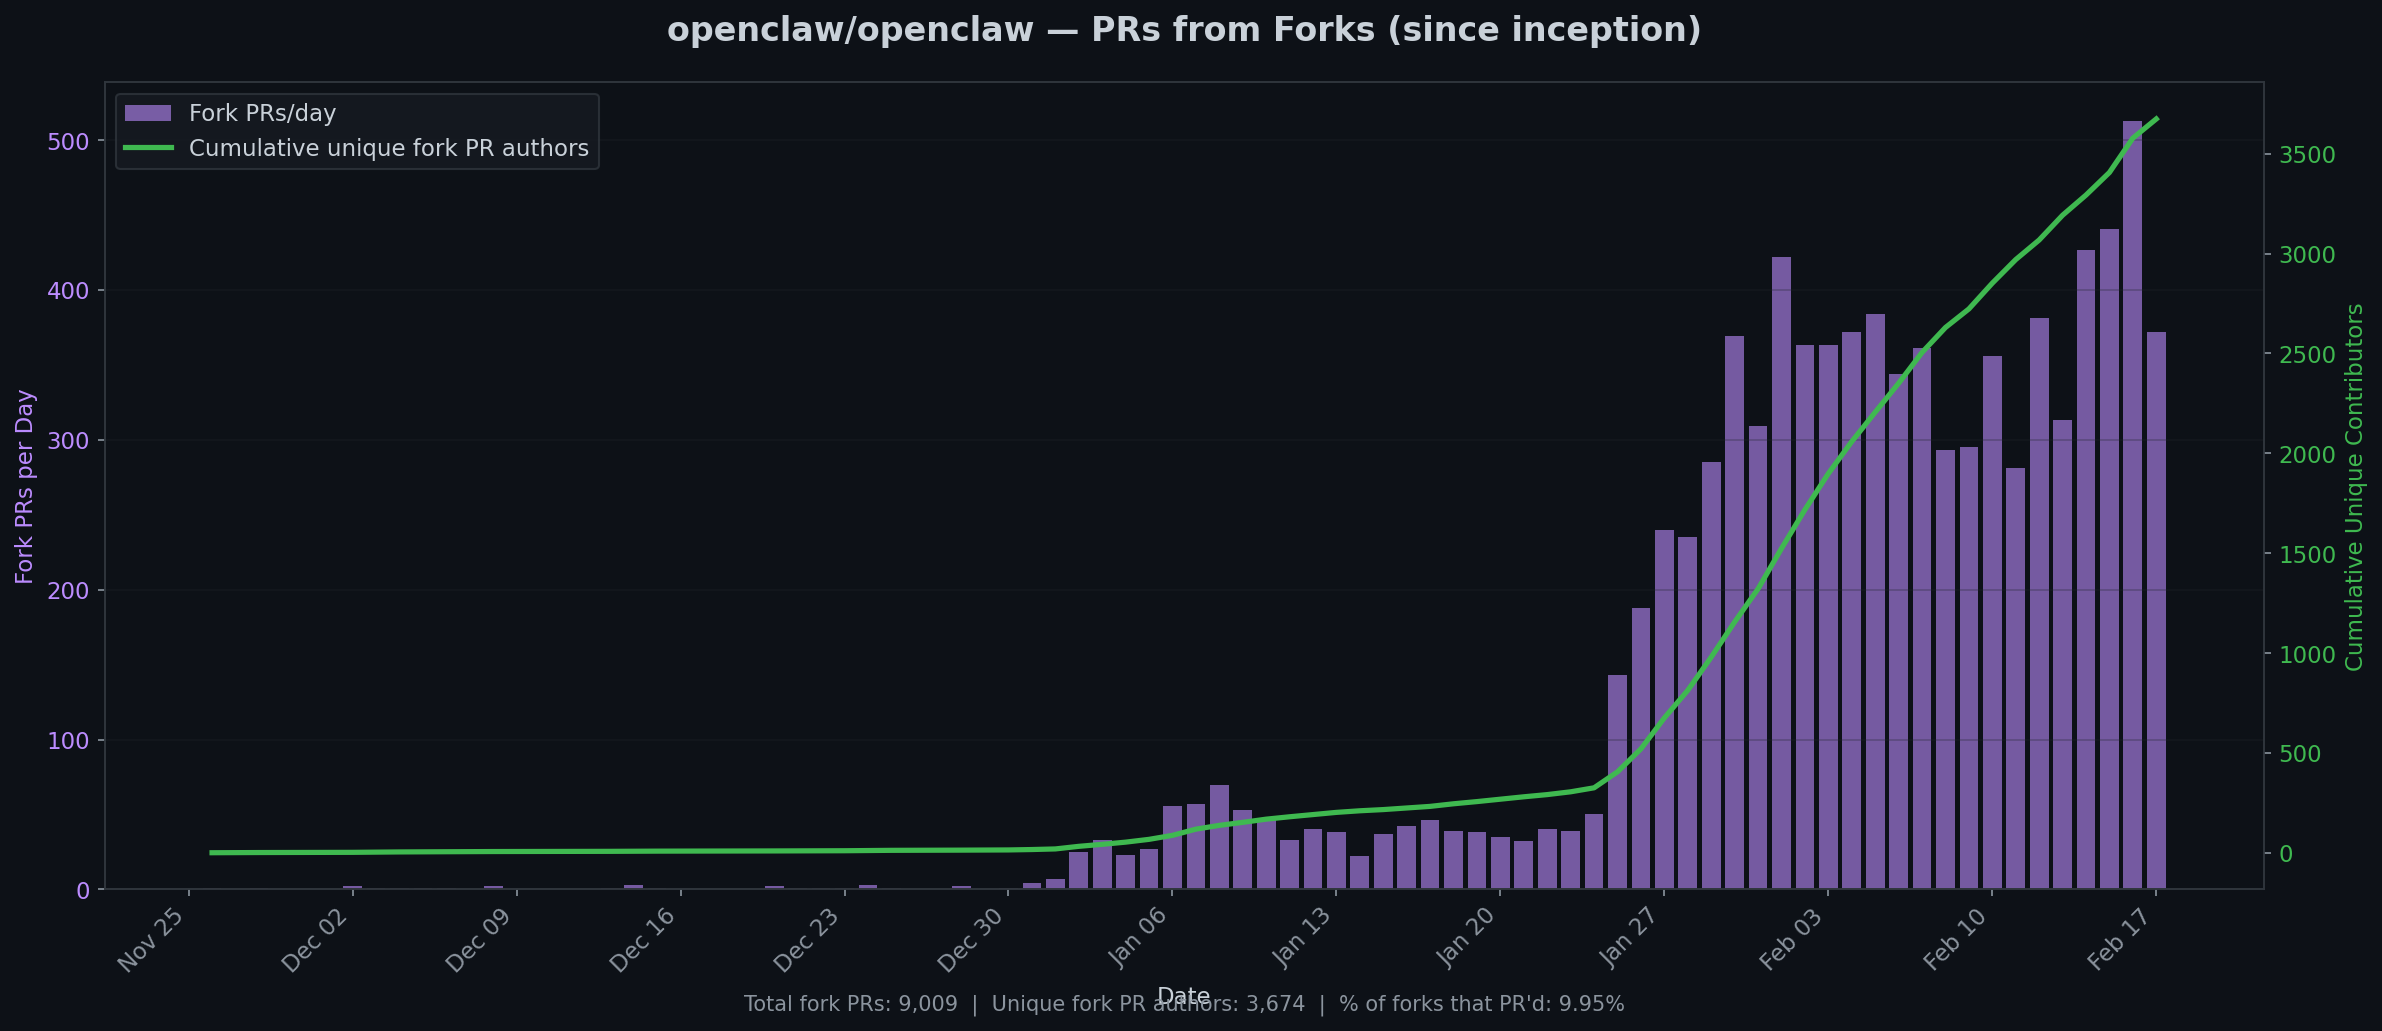
9,009 fork PRs from 3,674 unique authors. 9.95% of forks ever sent a PR upstream.

One in ten. That’s actually remarkable for open source.

For context: most popular GitHub projects see PR rates of 1-2% of their fork base. React, with its 10:1 star-to-fork ratio, gets far fewer contributors relative to its fork count. OpenClaw’s 10% is unusually high — partly because the project is young and actively soliciting contributions, partly because the architecture (plugins, extensions, MCPs) makes it easy to contribute without touching core code.

The daily PR count has been climbing steadily: from single digits in December, to 50/day in mid-January, to a sustained 300-500/day now. Cumulative unique contributors crossed 3,500 and show no signs of flattening. Whatever is happening to the fork rate, the contribution rate is still accelerating.

That divergence — declining forks, accelerating PRs — is the best signal in this entire dataset. It means the project is transitioning from “thing people try” to “thing people commit to.”

What we got wrong in Part 1

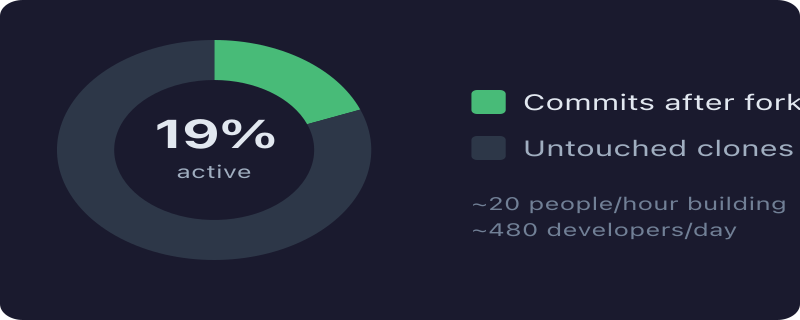
Our original sample of the 100 newest forks found 19% activity. The full dataset says 20.6%. We were within a rounding error, which is either a testament to sampling theory or dumb luck. Probably both.

What the sample couldn’t show was the shape of the curve — the early period of 60-90% engagement that collapsed as volume exploded. The 20% number is real, but it’s an average across two very different populations: serious developers who forked early, and a much larger wave of tourists who forked because it was trending.

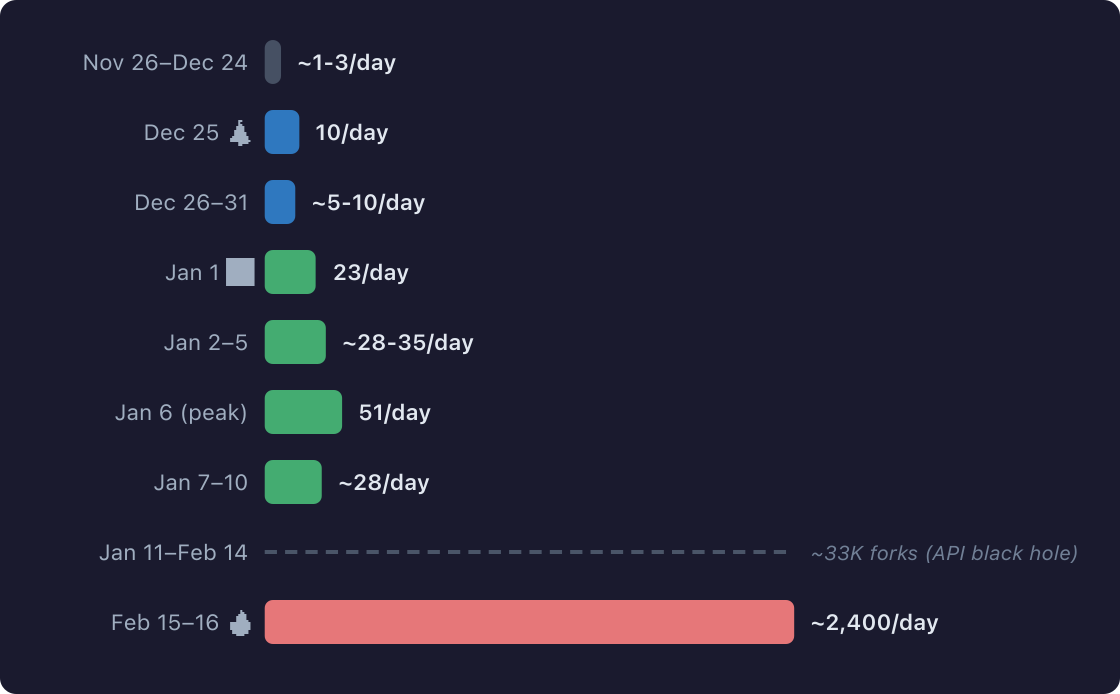
We also estimated “~2,400 forks/day” based on a snapshot. The real peak was 3,402. And by now it’s fallen to about 1,000. The snapshot caught a number that was already past its peak but hadn’t decayed enough to notice.

The numbers that matter

Forget 36,915 forks. Here’s what actually counts:

  • 7,591 forks with real commits — people building things
  • 3,674 unique PR authors — people giving back
  • ~500 PRs/day at current pace — and growing

That’s not a fork explosion. That’s a contributor ecosystem forming in real time. The other 29,324 forks are scenery.

We’ll explain shoelace eventually. Promise.


Full dataset: 36,915 forks and 9,423 PRs scraped from the GitHub REST API v3 on February 17, 2026. All forks paginated (no sampling). Commit activity measured by comparing pushed_at to created_at with a 1-hour threshold to filter initial fork sync. PR data from GitHub’s search API.

Part 1: Anatomy of a Fork Explosion

Anatomy of a Fork Explosion

OpenClaw has 34,600 forks.

Yesterday, its creator joined OpenAI.

These two facts are related in ways that are worth pulling apart.

What 34,600 forks actually looks like

A GitHub fork costs nothing — one click, two seconds. It’s a bookmark with delusions of contribution. So I pulled the data from GitHub’s API to see what’s actually going on underneath the vanity number.

GitHub’s API for listing forks returns a maximum of 400 results per request. You can sort by oldest or newest, so you get the first 400 forks ever created and the 400 most recent ones. The ~33,000 forks in between? Invisible. GitHub literally won’t show them to you. You’d need to scrape each fork individually or use their BigQuery dataset to see the full picture. I didn’t — so this analysis covers the bookends with a black hole in the middle. I’m not going to dress it up.

The growth curve

The first fork appeared November 26, 2025 — two days after the repo went public. For the next month: a trickle. One, two, three forks per day. Early adopters kicking the tires.

Then Christmas happened.

December 25: 10 forks. A 10x jump. People unwrapped laptops and had free time. The holiday week held steady at 5-10 per day.

January 1: 23 forks. Another 3x. By January 6, it peaked at 51 forks/day in the sample. New Year’s resolution energy: “this is the year I set up my own AI agent.”

And right now? ~100 forks per hour. 345 forks appeared in a 4.3-hour window. That’s a ~2,400/day pace.

The trajectory: 1/day → 10/day → 50/day → 100/hour.

Bar chart showing OpenClaw fork growth from 1-3/day in November 2025 to ~2,400/day in February 2026

Somewhere between people opening Christmas presents and Valentine’s Day, OpenClaw went from “interesting open-source tool” to “phenomenon.” Which is a convenient time for the phenomenon’s creator to get hired by the company that didn’t make it.

The 81% question

Here’s the part nobody talks about.

Of the 100 most recent forks — all created within the last hour of my sample — how many show any commit activity after forking?

19%.

The other 81% are untouched clones. Fork and forget. GitHub stars with extra steps.

Donut chart showing 19% of forks have commits after forking, 81% are untouched clones

But before you dismiss it: 19% of 100 forks per hour is still ~20 people per hour actually building something. That’s ~480 developers per day doing real work on top of OpenClaw. Not nothing. Especially for a project that, until yesterday, was one developer’s playground.

The ones who renamed their fork (and are apparently walking away from Omelas)

The most interesting signal isn’t volume — it’s intent. When someone renames their fork, they’re not cloning; they’re starting something new.

Highlights:

  • cl-core-mit-snapshot — someone freezing the codebase under MIT. Defensive forking. Just in case.
  • openclaw-x402-router — x402 payment protocol integration. Somebody’s building monetized agent infrastructure before the foundation even has bylaws.
  • reallyopenopenclaw — a philosophical statement in repo form. Already preemptively arguing with the future.
  • ladysclaw — rebranding energy.
  • clawguard — presumably security hardening.
  • shoelace — no explanation. Just vibes.

These are the 2% who forked with purpose. Watch them.

People aren’t just watching

OpenClaw’s stars-to-forks ratio is 5.7:1 (197K stars to 34.6K forks). For context:

  • React: ~10:1
  • Next.js: ~16:1

A low ratio means people are grabbing the code, not just bookmarking it. OpenClaw’s is unusually low. Whether that’s because the tool rewards customization, because the ecosystem hasn’t consolidated around plugins yet, or because people want to run it privately and not tell anyone — probably all three.

And now that the creator is inside OpenAI and the project is headed for a foundation? That cl-core-mit-snapshot fork starts looking less paranoid and more prescient.

The timing

Peter Steinberger announced yesterday that he’s joining OpenAI. Sam Altman said on X that OpenClaw will “live in a foundation as an open source project that OpenAI will continue to support.”

So let me get this straight: The tool was originally called ClawdBot — you can guess which model it was built for. The tool’s creator just joined OpenAI. The tool will live in a foundation that OpenAI sponsors. And 34,600 people have already forked the code, 81% of whom will never touch it again.

If you’re keeping score at home, a developer built a personal agent, originally called it ClawdBot (no points for guessing the model), made it go viral, got hired by OpenAI, and the project is now an “independent foundation” that OpenAI “supports.” This is like a Ford engineer building the best car on the market using Toyota engines, then getting hired by GM to “drive the next generation of personal vehicles.”

The claw is the law, apparently. Just not any particular company’s law.

What I couldn’t measure

Two of my three original questions remain unanswered:

  1. ✅ Fork creation over time — covered, with the API gap caveat
  2. ❌ Forks with independent commits — sampled 100, can’t do all 34,600 without days of API scraping
  3. ❌ Forks that sent PRs back to main — same problem, worse

A more rigorous analysis would use GitHub’s BigQuery dataset. This was a 30-minute investigation, not a thesis. But the 30 minutes told a story.

The real question

34,600 forks sounds massive. It is massive. But the real number is somewhere between 6,500 (19% active) and 700 (2% with intent). Still impressive, and still accelerating.

The open-source AI agent space is in its “everybody forks, nobody contributes back” phase. That’s fine — it’s how platforms grow. The interesting question isn’t how many forks exist today. It’s how many of them will still have commits six months from now, when the foundation has governance, when OpenAI’s priorities inevitably diverge from the community’s, and when the next shiny thing comes along.

History suggests: about 2%. But those 2% will be the ones that matter.


Data pulled from the GitHub REST API v3 on February 15–16, 2026. Fork listing capped at 400 per sort direction; findings are based on sampled bookends, not the full dataset.

Patterns: descriptivism vs prescriptivism

This is going to be so short, it requires this sentence to say so so it appears a bit longer.

It seems that there are two ways of looking at them. Prescriptive: “When faced with a problem of class X, use pattern A”. Or descriptive, “When faced with a problem of class X, a lot of times engineers use approaches Alpha, Beta, Gamma that have a particular pattern in common; let’s extract it and call it A so we have a common terminology.”

The “prescriptive” part really should be a “strong suggestion” added weight to by the fact that it is widespread enough to get a name, but nothing beyond that. (See also “Thinking outside the box“).

What prompted this? Well, TIL that exercises such as Ad hoc querying on AWS have a name: “lakehouse“, and that I’ve apparently been thinking about how best to do “Reverse ETL” without thinking “Reverse ETL”. Well, I guess that’s open source marketing.

This post is not making any prescriptions.